Data Note 51
By Jean E. Winsor
Since Fiscal Year 1988, the Institute for Community Inclusion has administered the National Survey of State Intellectual and Developmental Disability Agencies’ (IDD Agencies) Day and Employment Services. The work is funded by the Administration on Developmental Disabilities and is designed to describe the nature of day and employment services for individuals with intellectual and developmental disabilities.
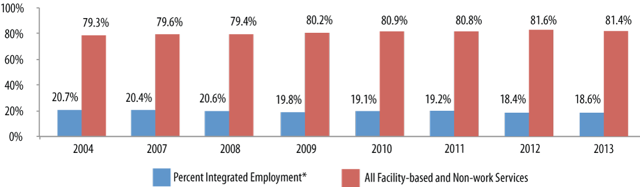
In FY2013, an estimated 607,959 individuals received day or employment supports from state IDD program agencies. This number grew from 457,405 in FY1999. The estimated number of individuals in integrated employment services increased from 108,680 in FY1999 to 113,271 in FY2013. State investment continues to emphasize facility-based and non-work services, rather than integrated employment services. Figure 1 shows the trends in the percentage of people served in integrated employment and facility-based and non-work settings between FY2004 and FY2013.
Major findings include:
- National estimates suggest that there has been modest growth in the number of individuals in integrated employment since 1988.
- The estimated percentage of individuals participating in integrated employment services was 18.6% in FY2013.
- Growth in supported employment primarily occurred between the mid-1980s and mid-1990s, and there has been a decline in the number of people with IDD in integrated employment since 2001.
- Growth in community-based non-work services has continued for states that report offering this service.
- There is large variation across states in participation in integrated employment (Table 1).
Figure 1. Estimated IDD Agency Service Distribution by Year
2004 | 2007 | 2008 | 2009 | 2010 | 2011 | 2012 | 2013 | |
Percent Integrated Employment* | 20.7% | 20.4% | 20.6% | 19.8% | 19.1% | 19.2% | 18.4% | 18.6% |
All Facility-based and Non-work Services | 79.3% | 79.6% | 79.4% | 80.2% | 80.9% | 80.8% | 81.6% | 81.4% |
*Percents displayed represent estimates for the number of people served in integrated employment nationally including all 50 states and Washington, DC
State | Total Served | Percent Integrated Employment | Percent Community Based Non-work | Percent Facility Based Work | Percent Facility Based Non-work |
|---|---|---|---|---|---|
AK | 1,608 | 26% | 0% | 0% | 98% |
AL | 4,893 | 4% | 0% | 2% | 94% |
AR | -1 | -1 | -1 | -1 | -1 |
AZ | 7,471 | 21% | 0% | 12% | 67% |
CA | 79,833 | 12% | 75% | 13% | 0% |
CO | 7,706 | 27% | 74% | 0% | 54% |
CT | 9,764 | 49% | 51% | 4% | 0% |
DC | 1,253 | 12% | -1% | 0% | 87% |
DE | 1,923 | 29% | 13% | 24% | 31% |
FL | 16,653 | 14% | 0% | 0% | 0% |
GA | 19,854 | 13% | 26% | 0% | 60% |
HI | 2,180 | 2% | 90% | 1% | 56% |
IA | 12,998 | 17% | 0% | 25% | 58% |
ID | -1 | -1 | -1 | -1 | -1 |
IL | 24,178 | 6% | 0% | 1% | 93% |
IN | 13,049 | 15% | 71% | 34% | 43% |
KS | 6,200 | 13% | 53% | 50% | 58% |
KY | 7,072 | 18% | 96% | 0% | 13% |
LA | 5,346 | 31% | 0% | 29% | 39% |
MA | 15,523 | 29% | 17% | 20% | 55% |
MD | 12,663 | 40% | 0% | 0% | 60% |
ME | 3,515 | 28% | -1 | -1 | -1 |
MI | 17,746 | 23% | 36% | 25% | 28% |
MN | 22,306 | 13% | 25% | 53% | 8% |
MO | 5,618 | 12% | 6% | 0% | 89% |
MS | -1 | -1 | -1 | -1 | -1 |
MT | 1,854 | 12% | 0% | 0% | 88% |
NC | 13,625 | 22% | 28% | 19% | 33% |
ND | -1 | -1 | -1 | -1 | -1 |
NE | -1 | -1 | -1 | -1 | -1 |
NH | 3,603 | 38% | 65% | 0% | 0% |
NJ | 11,910 | 11% | 0% | 22% | 63% |
NM | 3,332 | 33% | 75% | 0% | 50% |
NV | 2,372 | 18% | 1% | 44% | 36% |
NY | 56,873 | 13% | 0% | 14% | 82% |
OH | 34,689 | 21% | 0% | 54% | 41% |
OK | 4,050 | 62% | 28% | 55% | 0% |
OR | 10,919 | 33% | 32% | 24% | 25% |
PA | 28,133 | 18% | 44% | 33% | 33% |
RI | 3,475 | 33% | 58% | 14% | 77% |
SC | 7,425 | 29% | 11% | 38% | 42% |
SD | 2,490 | 18% | 31% | 67% | 31% |
TN | 7,026 | 19% | 92% | 0% | 53% |
TX | 46,043 | 8% | 0% | 1% | 54% |
UT | 3,131 | 23% | 81% | 0% | 0% |
VA | 14,127 | 24% | 4% | 4% | 68% |
VT | 2,905 | 38% | 63% | 0% | 0% |
WA | 8,280 | 86% | 12% | 8% | >1% |
WI | 15,367 | 21% | 13% | 44% | 50% |
WV | 2,134 | 41% | 100% | 1% | 58% |
WY | 1,428 | 18% | 0% | 9% | 72% |
Suggested Citation
Winsor, J. E. (2015). State intellectual disability and developmental disabilities agencies’ service trends. DataNote Series, Data Note 51. Boston, MA: University of Massachusetts Boston, Institute for Community Inclusion.
Acknowledgments
This is a publication of StateData.info, funded in part by the Administration on Developmental Disabilities, U.S. Department of Health and Human Services (#90DN0216).